Purpose
The code was initially based on a set of Python scripts developed by Dr. Shae Padrick, which fits protein binding and actin polymerization data. The reasons for creating this website are:
- The long-time frustration of using graphs generated by Excel to make publication- quality figures in Adobe Illustrator
- The major barrier of learning Python coding for biochemists
- Flexibility of uploading and editing data sets in plain text or CSV formats
- Ability to store, retrieve, and share work sessions
-
Full customization of graphs
- Currently supporting line/scatter and swamp/bar graphs (more coming)
- Generation of publication-quality graphs that can be directly edited in Adobe Illustrator
-
Transparency of data analysis results
- All analysis results can be saved with raw data to comply with good practices of lab note taking
Credits
Developers
BiochemPy Web App Development Team- Leyuan Loh
- Ganesh Prasad
- Finlan Rhodes
- Aubrey Uriel Sijo-Gonzales
COM S 402 (Undergraduate Senior Design) FA' 2021
Current Developer
-
Andy Foo Guo Zhen
Undergraduate Student
Department of Computer Science
Iowa State University
Acknowledgements
-
Shae Padrick, PhD
Original Python Script Developer
Assistant Professor
Dept. of Biochemistry & Molecular Biology
Drexel University College of Medicine
Original Script Citations:- Doolittle LK, Rosen MK, Padrick SB. (2013) Measurement and analysis of in vitro actin polymerization. Methods in Molecular Biology 1046:273–293.
- Shae Padrick, PhD, SBP_data_analyze.py (v0.77) [Source code]. SBP_data_analyze.py file download
-
Baoyu (Stone) Chen, PhD
Instructor of BiochemPy Development
Assistant Professor
Roy J. Carver Dept. of Biochemistry, Biophysics & Molecular Biology
Iowa State University -
Miles Aronnax
Manager Information Technology Systems
College of Liberal Arts & Sciences Administration
Iowa State University -
Iowa State Research IT
College of Liberal Arts & Sciences
Iowa State University
https://researchit.las.iastate.edu/ -
Simanta Mitra, PhD
Professor | Course Instructor for COM S 402
Department of Computer Science
Iowa State University -
Graham Mobley
Undergraduate Student
Department of Computer Science
Iowa State University
Version 2.1
10/29/2022
What's New?
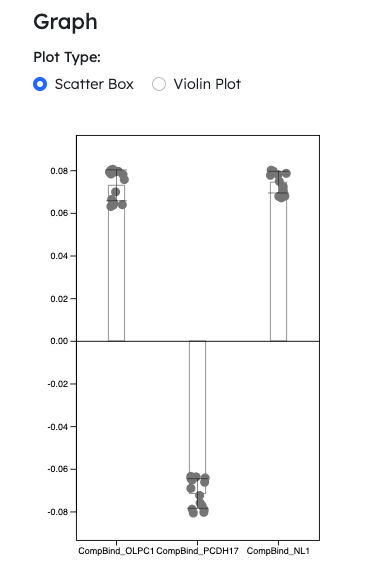
- Hotfix: Plotting for negative values
- Single column plotting for Module 1 accepts negative values
- Scatter box plot and violin plot now supports negative value plotting
- NOTE: Negative value plots will not work with log scale option turned on
Version 2.0
9/18/2022
- New Linear Regression Module
- Fits and computes gradient, r^2 value and y-intercept for multiple datasets
- Users can choose to fit datasets through origin or perform normal linear regression fitting
- Range settings for individual datasets can be adjusted prior to linear regression fitting
- Graph's legend shows fitted equation for fitted line
- Download Result(s) button allows users to download computed results in csv format

Version 1.3
8/6/2022
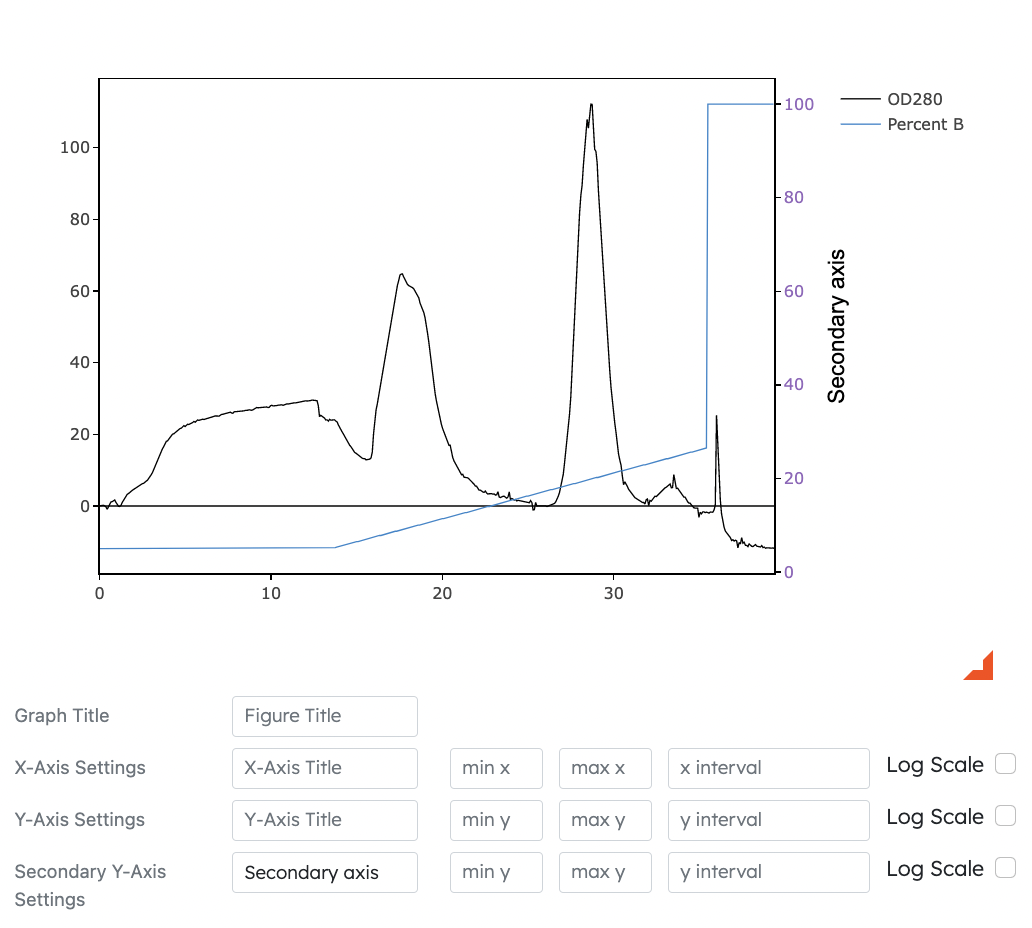
- Secondary Y Axis
- Dyanamically displays selected dataset on graph while using secondary y-axis options as reference
- Users can toggle secondary Y axis options for Modules 1, 2 and 3
- Settings for secondary Y axis such as title, min, max, intervals and log scale can be adjusted
- Fix: Button delay issues resolved
- Mac users no longer have to double click to load example datasets
- Line options and marker options change instantaneously when clicked
- Imrpoved reliability for email retrieval functionality
- Frontend to Backend roundtrip expected to work even after MySql pods are restarted
Version 1.2
5/12/2022
- Line Graphs
- Smoother log scale curves for Modules 2 and 3
- Reorganized columns for 'Customize Graph' table and made them more compact
- Adjustable X and Y axes
- Add 'Reference Line' option for Module 4
- Automatic calculation of max and min inten values for each dataset
- 'Input Module Parameters' only displays rows for plotted dataset and selected reference line
- New default settings for line plots
- Set line width to 1
- If dataset has more than 20 points, set marker width to 0
- If dataset has at most 20 points, set marker width to 10
- Swamp Graphs
- New option for dynamically resizing bars and graph space
- New default settings for swamp plots
- Set bar color to white with black boundary of width .5
- Set marker color to gray with 50% opacity
- Set marker size to 10
- Default to addition of capped error bars for standard deviation
Version 1.1
2/23/2022
- New website design and improved interfaces
- Bar widths for scatter box graphs are now customizable
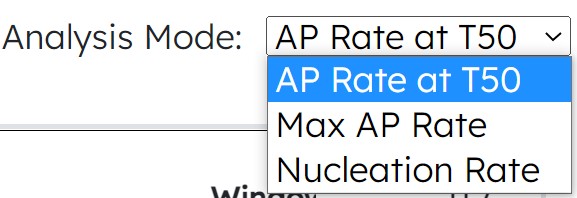
- New Module 4 Actin Analysis Modes: Max AP Rate, Nucleation Rate
- Addition of 'Edit Data' button on 'Results' page
- Changes to Task Retrieval Link feature:
- Form to create a new session is now on the 'Results' page
-
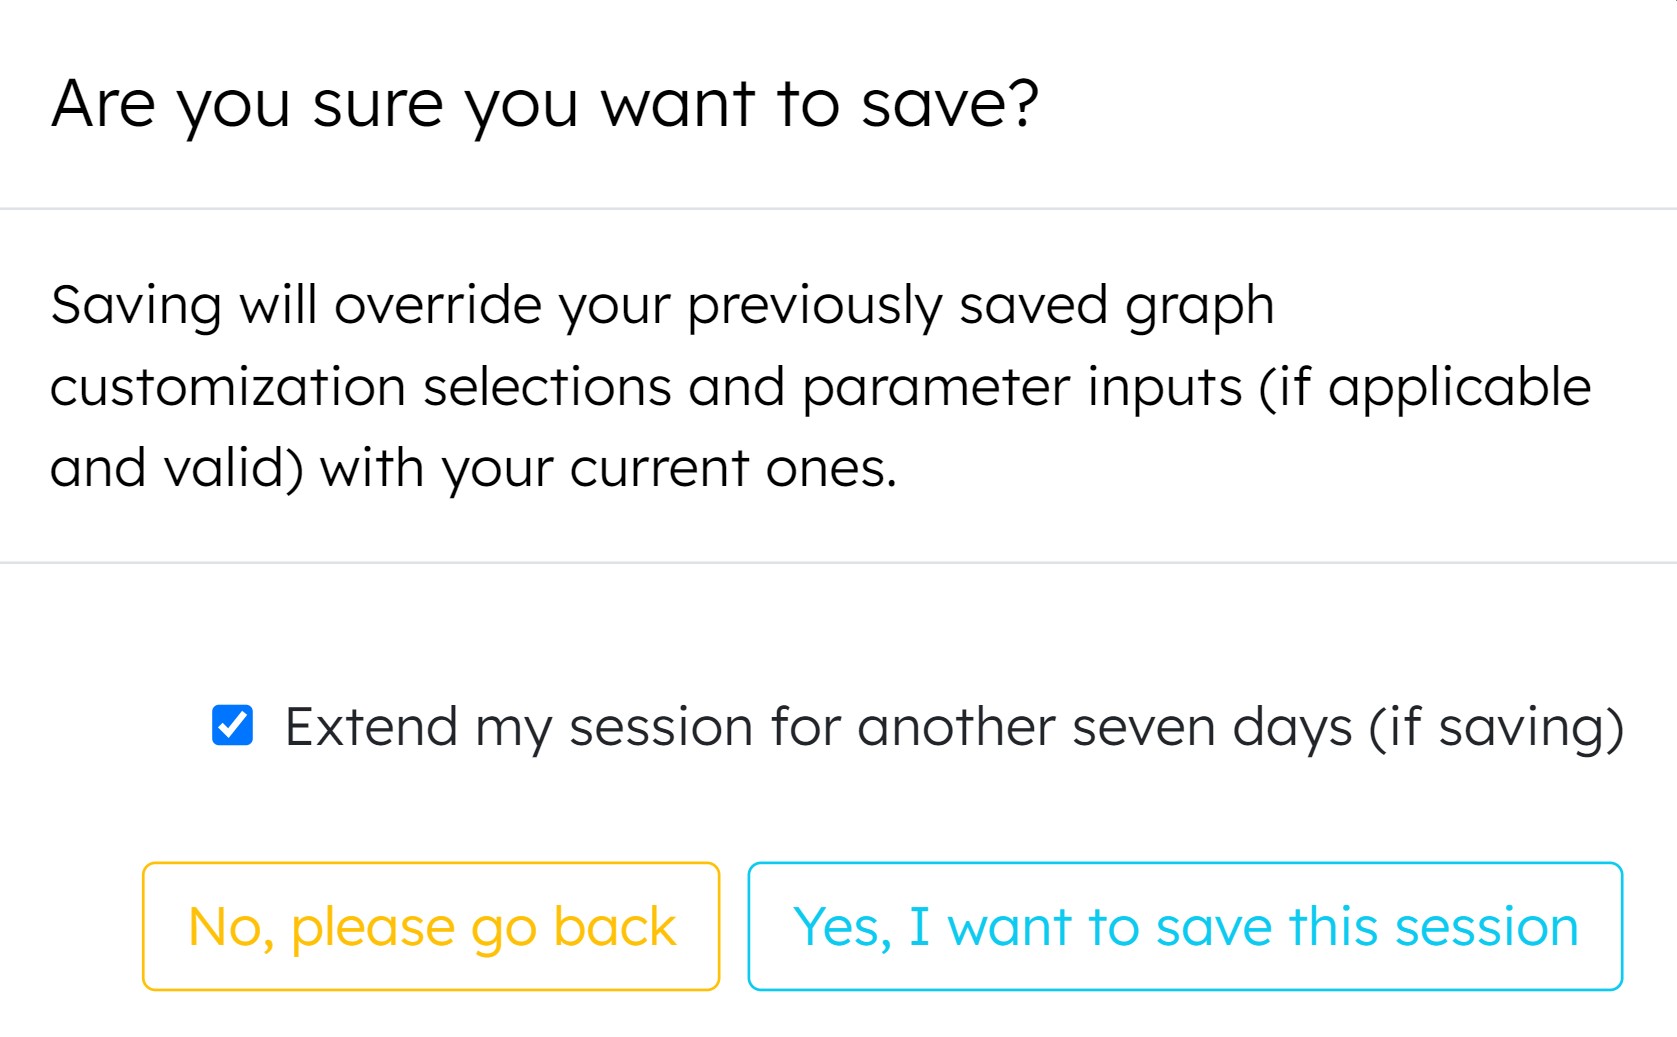
Enable user to extend session for another seven days
(Popup for extension option appears after pressing 'Save Session' in a current session)

Version 1.0
12/28/2021
- Download Swamp Bar graphs for Module 1 (Plot Data)
- Merged Scatter Plot and Line Plot options into only one Line Plot option for Module 1 (Plot Data)
- To remove markers, set marker size to 0
- To remove lines, set line width to 0