Help
Need help getting started with BiochemPy?
Select one of the tabs below to learn more about each page and their available features
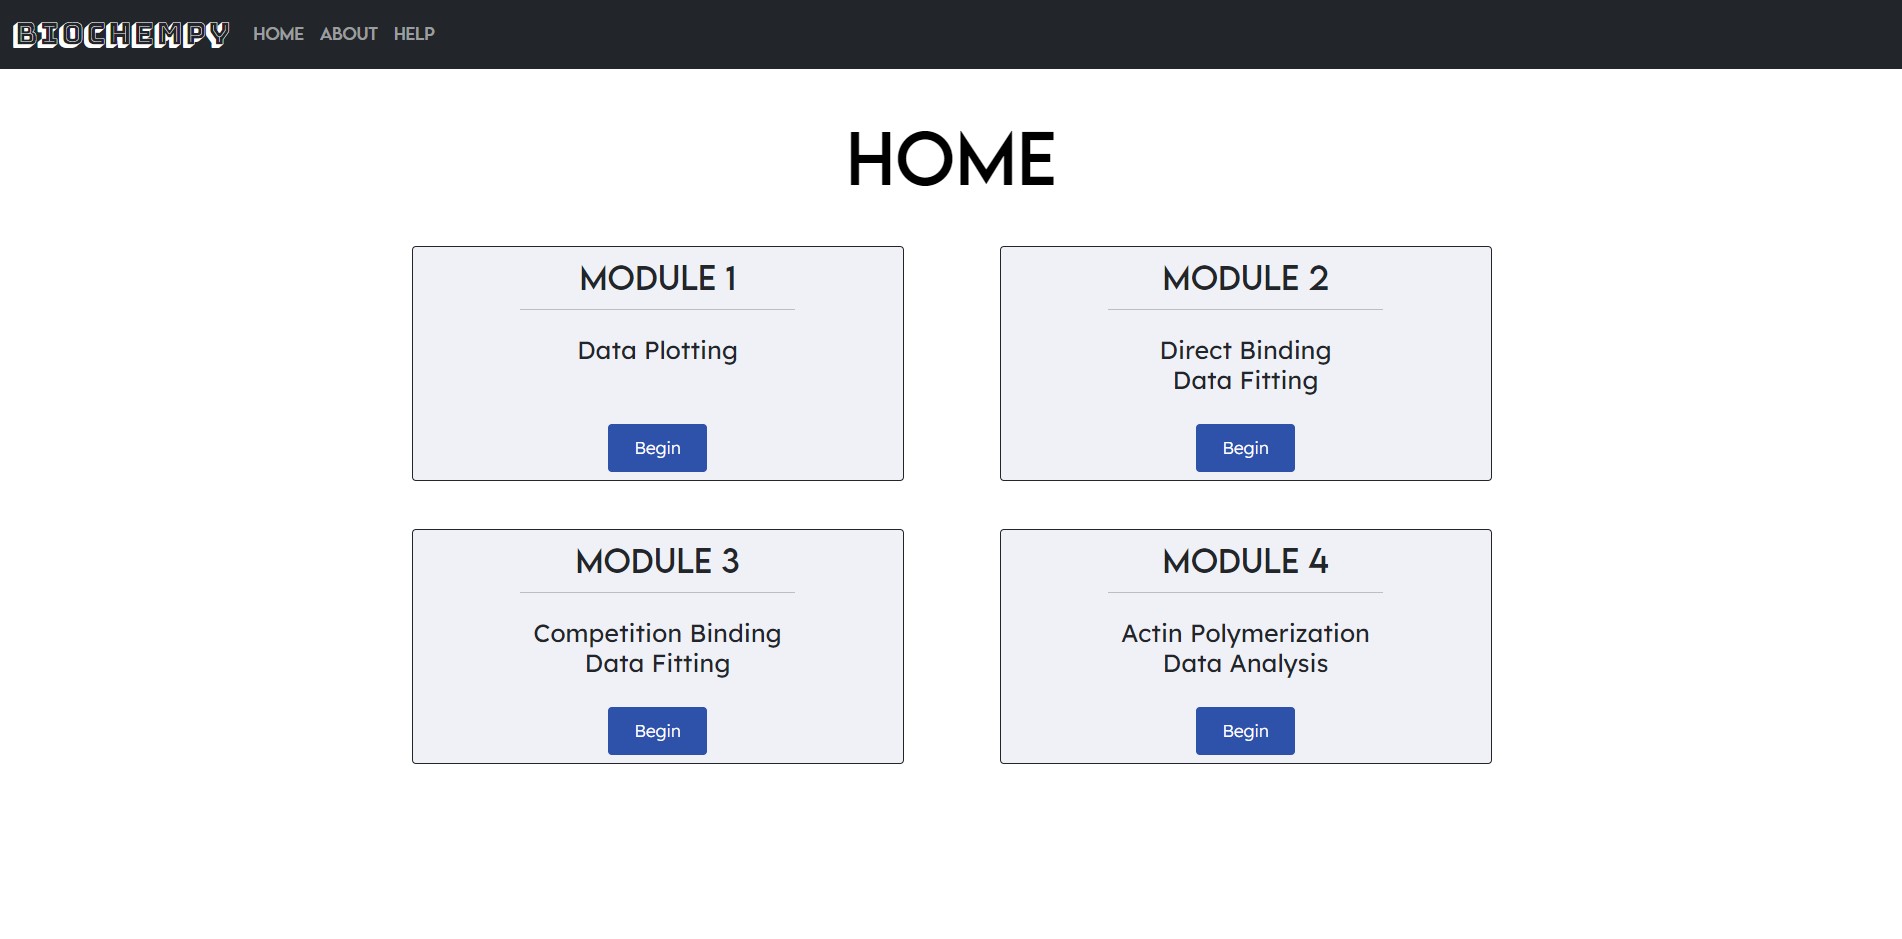
The Four Modules
*All graphs can be downloaded as a
.svg file*
-
Module 1
-
Used to make plots of different types based on data uploaded by the user
- Create scatter + line plots for 2-column or xy datasets
- Create scatter box plots (aka swamp plots) or violin plots for 1-column datasets
-
Used to make plots of different types based on data uploaded by the user
-
Analysis Modules:
(These make scatter + line plots using 2-column or xy datasets)-
Module 2
- Used to fit a non-linear model to direct binding data
-
Module 3
- Used to fit a non-linear model to competition binding data
-
Module 4
- Used to determine the time at which a polymerization reaction is 50% complete, and the rate of polymerization at this point
- Has 3 different analysis modes available on the "Results" page
-
Module 2


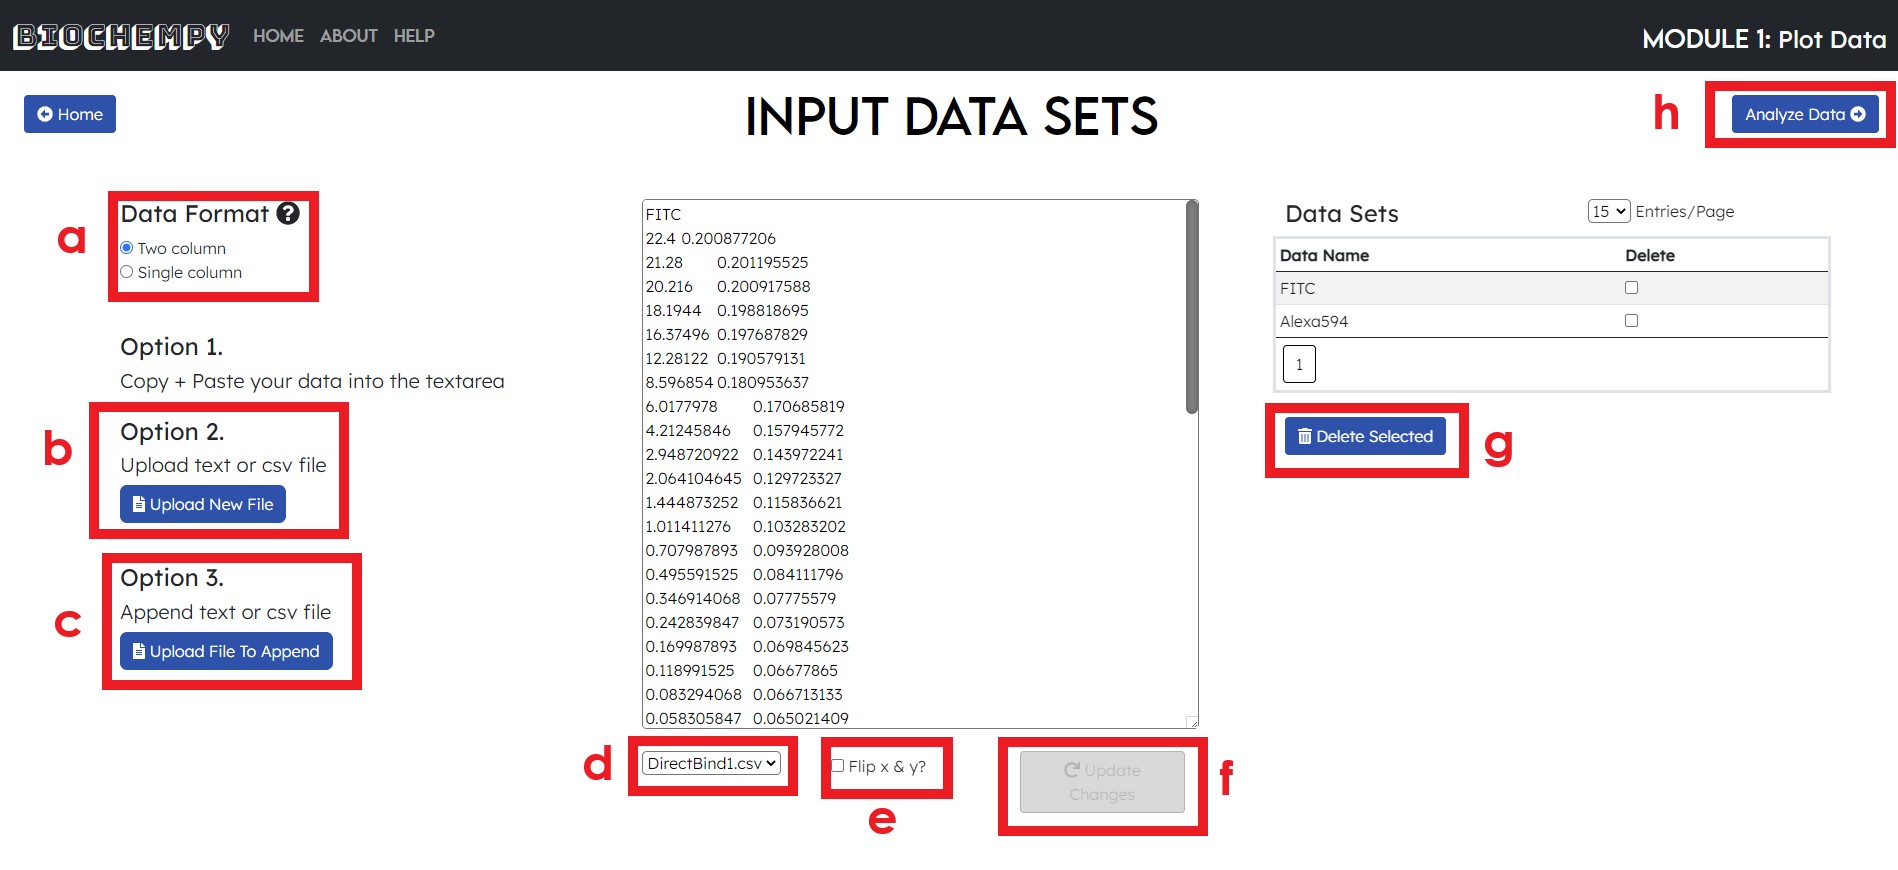
Available Features
-
Data Format Radio Buttons
(Only applicable to Module 1)-
Two-column data consists of xy pairs
A two-column dataset is used to make scatter and line plots, where:- the x values determine point position on the horizontal axis
- the y values determine point position on the vertical axis
-
Single-column data consists of x values only
A single-column dataset may be used to create either:
-
A scatter box plot, where:
- the x values determine point position on the vertical axis
- the name of the dataset determines horizontal position
-
A violin plot, which:
- visualizes the peaks and distribution of the x values
-
A scatter box plot, where:
-
Two-column data consists of xy pairs
-
Upload New File
-
Accepts
.csvand.txtfiles -
Overwrites existing content in the textarea with the uploaded datasets given that the format of file content is valid
- Uploading a file with valid data format does not require the user to click on 'Update Changes'
-
Accepts
-
Upload File To Append
-
Also accepts
.csvand.txtfiles -
Appends uploaded datasets to existing data within the textarea
- Uploading a file with valid data format does not require the user to click on 'Update Changes'
-
Also accepts
-
Example Data Dropdown
- Provides various examples of valid data that are available to use according to the selected module
-
Flip x & y Checkbox
-
Given two-column datasets, this flips the x and y values for each dataset in the text area
NOTE: The 'Update Changes' button must be clicked after flipping the xy pairs
-
Given two-column datasets, this flips the x and y values for each dataset in the text area
-
Update Changes
- Must be clicked only after making direct changes to the textarea or flipping the xy pairs on two-column datasets
-
Delete Selected Button
- Deletes selected data sets on the 'Data Sets' table and updates the content of the textarea accordingly
-
Analyze Data Button
- Navigates the user to the "Results" page given that valid data sets have been input or provided
Required Data Format
For Uploaded Files and Textarea Content
-
For
.csvfiles,- All data set names must be on the first row
- Numeric x values must be directly beneath the dataset name
- Numeric y values (if present) must be immediately to the right of the x values
Figure 1: single-column datasets 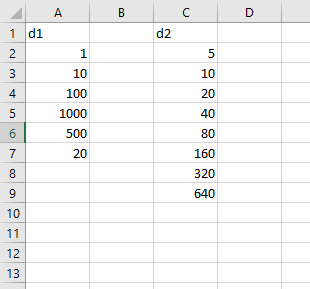
Figure 2: two-column datasets 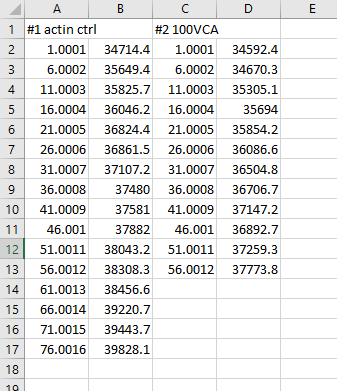
-
For
.txtfiles,-
Start with the data set name and follow with rows that each correspond to numeric value/s
- For two-column datasets, separate the x and y values on each row with either a space or a tab
- Separate each data set with a new line before each data set name
*NOTE* Content of the textarea must follow the same required data format for.txtfilesFigure 3: single-column datasets 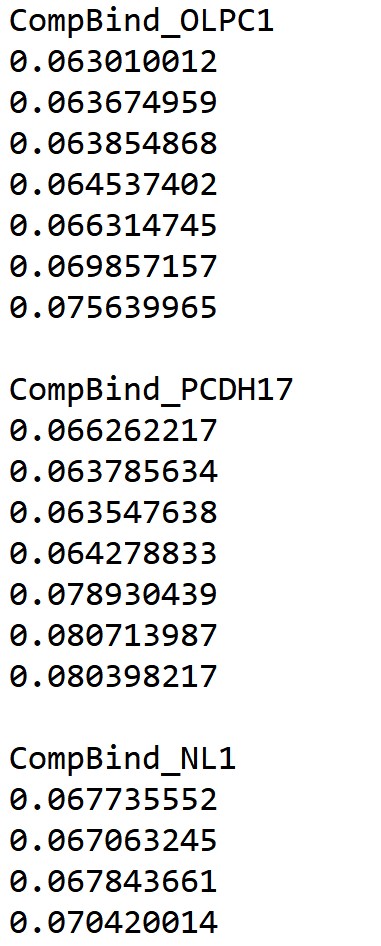
Figure 4: two-column datasets 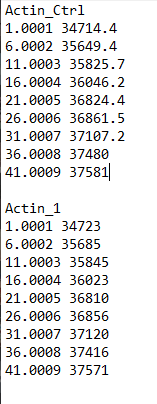
-
Start with the data set name and follow with rows that each correspond to numeric value/s
Graph Customization
Scatter + Line Plots
-
'Customize Graph' Table
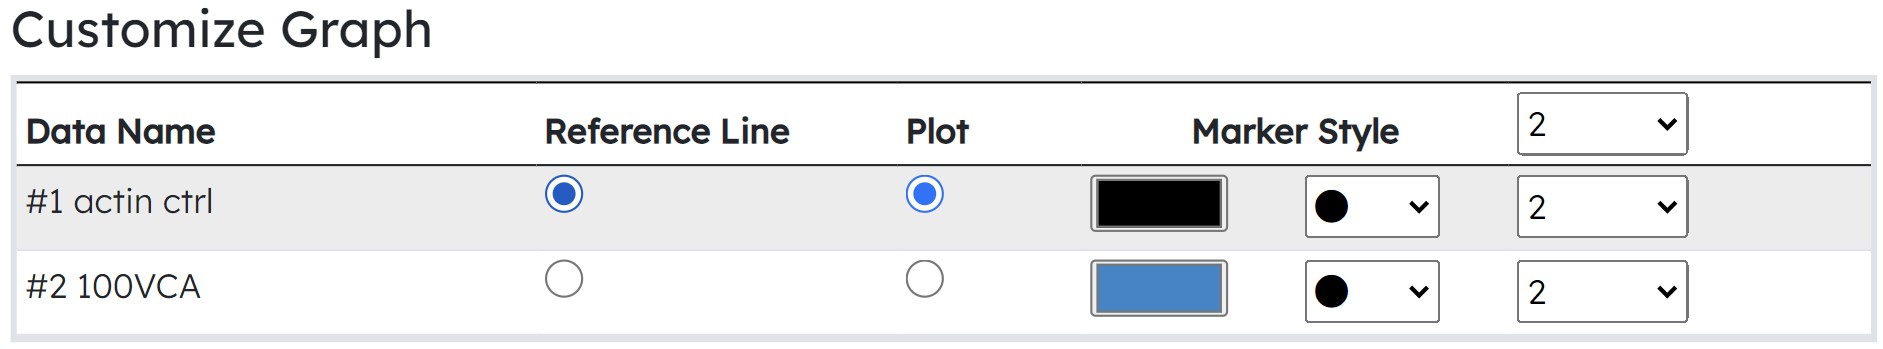 'Customize Graph' table for Module 4
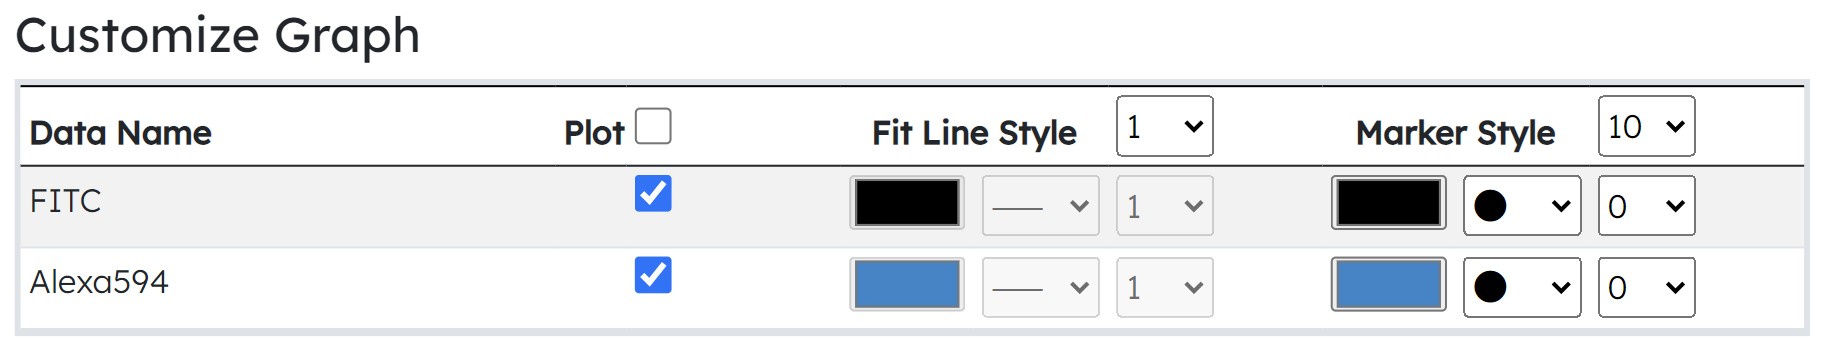 'Customize Graph' table for Modules 1, 2, and 3
-
Reference Line
(Applicable only to Module 4)- Determines which dataset's min and max actin lines to use and plot on the graph after performing actin analysis
-
Plot
- Toggles the display of line and scatter points for a dataset on the graph
-
Line Style
(only becomes available after clicking 'Fit Dataset' atop the 'Input Module Parameters' table)- Includes the following options:
- Line color
- Line type, e.g. solid/dash
- Line width
-
Marker Style
- Includes the following options:
- Marker color
- Marker shape
- Marker width
-
Reference Line
-
Figure Labels and Axis Settings Form
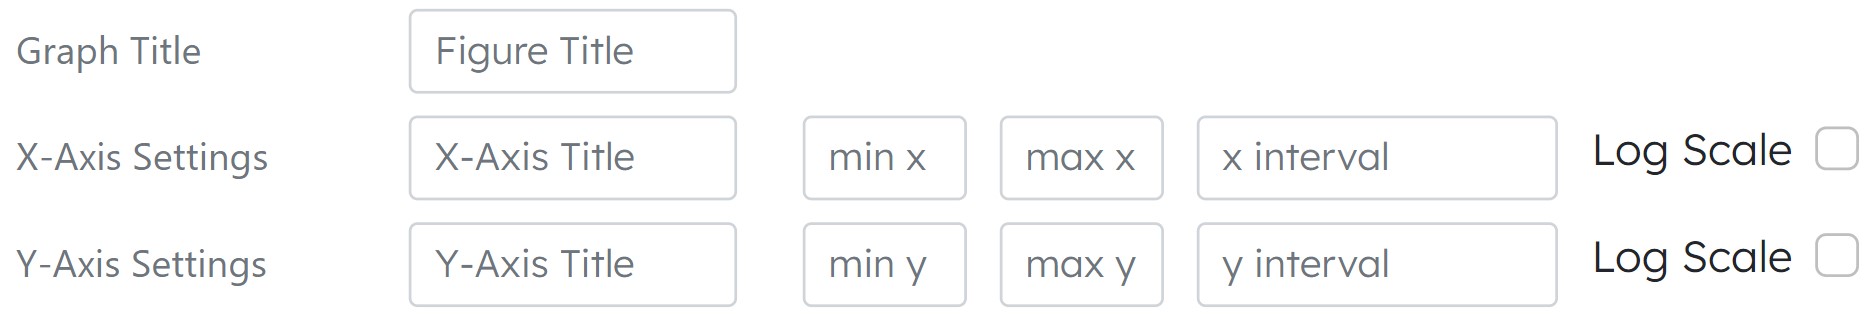
- Configure graph and axes titles
- Toggle log scale on each axis
- Change interval and range of each axis
-
Graph Resize Grabber
(Also available for violin plots under Module 1)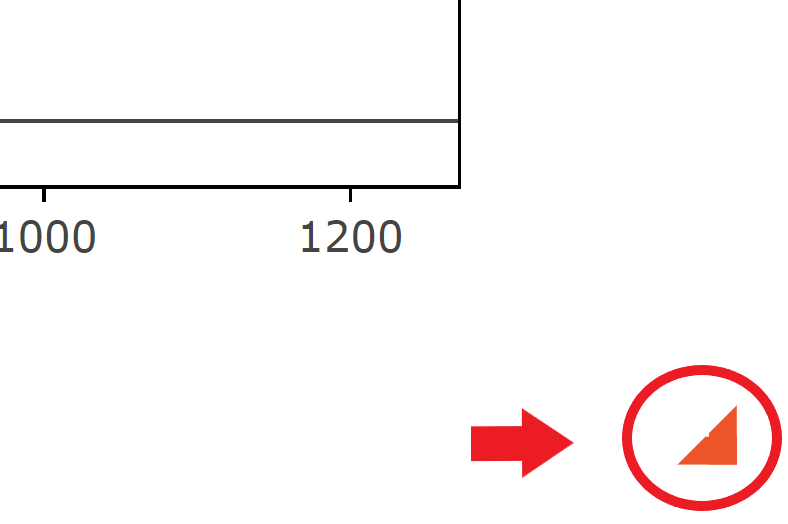
- Dynamically resizes graph with a click and drag
- Found on the bottom right of the graph space
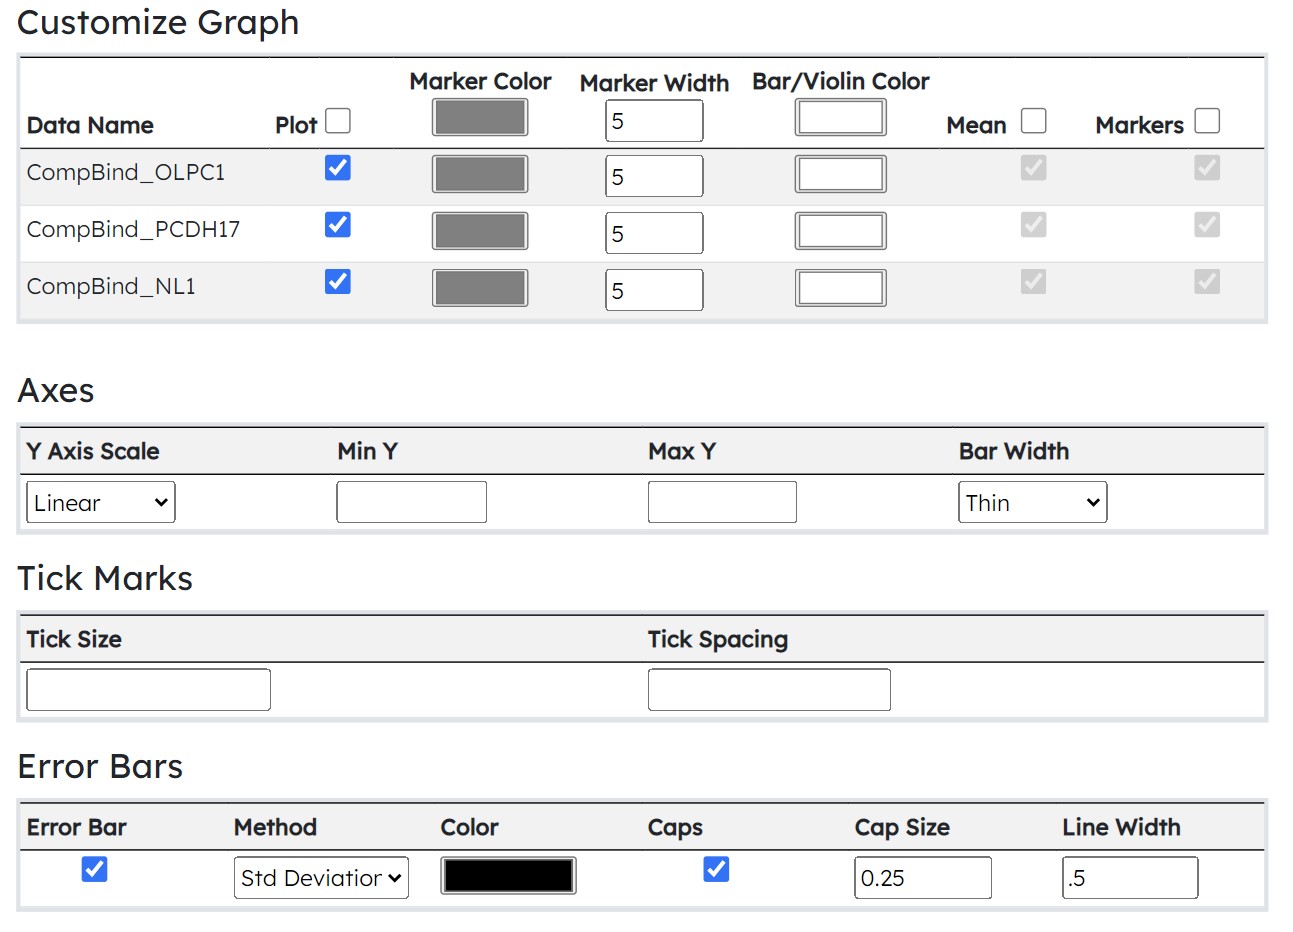
Graph Customization
Scatter Box & Violin Plots
-
Figure Labels Form

- Configure graph and axes titles
-
Other Customization Options
*NOTES*
- Custom options in orange are for violin plots only
- Custom options in blue are for swamp or scatter box plots only
-
Base Custom Options
-
Plot
- Toggles the display of the dataset as either a bar or a violin on the graph
- Marker Color
- Marker Width
- Bar/Violin Color
-
Mean
- Toggles the display of a mean line for the violin that represents a dataset
-
Markers
- Toggles the display of markers on the violin that represents a dataset
-
Plot
-
Axes
-
Y Axis Scale
- Toggle linear or log scale for y axis
-
Min Y
- Set minimum for y axis
-
Max Y
- Set maximum for y axis
-
Bar Width
- Offers three preset sizes: Thin, Medium, Wide
- Dynamically resize width of bars on the graph and shift them accordingly on the x axis
-
Y Axis Scale
-
Tick Marks
-
Tick Size
- Sets the length of the ticks on both axes
-
Tick Spacing
(available for both swamp or scatter box plots and violin plots)- Sets the interval between each tick on the y axis
-
Tick Size
-
Error Bars
-
Error Bar
- Toggles the appearance of an error bar for each plotted bar on the graph based on the error method selected
-
Method
- Determines the error method to use and show as an error bar for each plotted bar on the graph
-
Color
- Sets the color of each error bar
-
Caps
- Attaches a cap on both ends of each error bar
-
Cap Size
- Sets the length of each cap
-
Cap Width
- Sets the width or thickness of each cap
-
Error Bar
Data Analysis
Modules 2, 3, and 4
-
'Input Module Parameters' Table
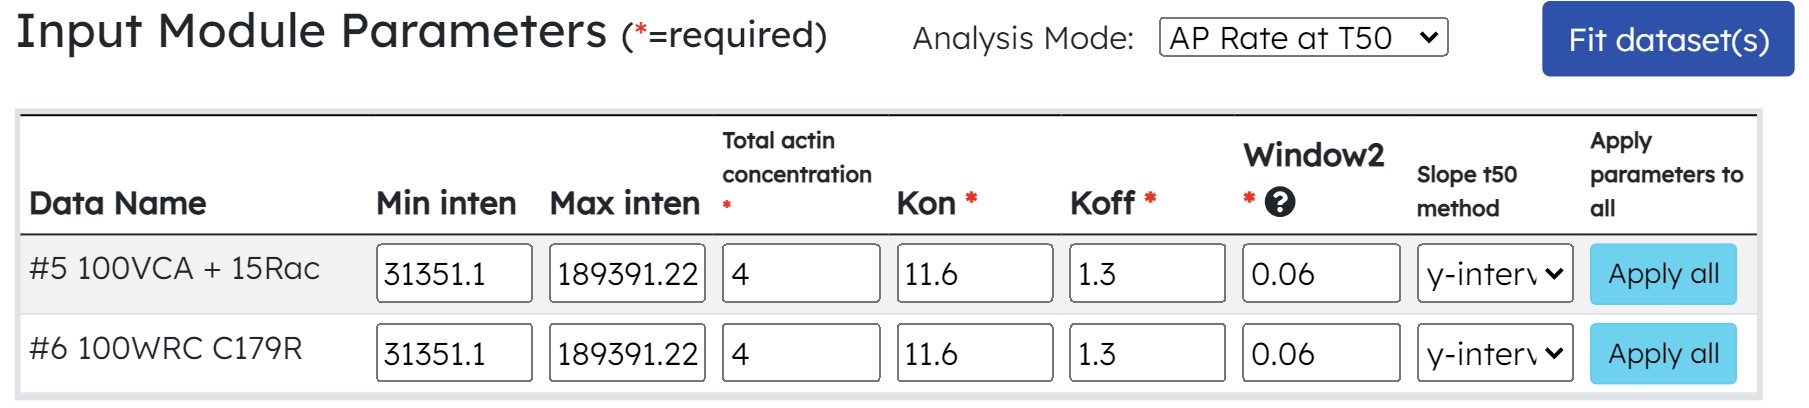
'Input Module Parameters' table for Module 4 -
'Analysis Mode' dropdown is only available for Module 4
-
Provides different preset/recommended Window2 values according to selected actin analysis mode
- Window2 determines which area of concentrated points on the plotted line to highlight on the graph
-
Provides different preset/recommended Window2 values according to selected actin analysis mode
-
Includes fields for each parameter to perform data analysis according to the selected module
- List of required parameters differ according to the selected module
-
'Fit Dataset' button performs data analysis using the values provided for each parameter
-
Successful execution of data analysis does the following:
-
For Modules 2 and 3
- Graph the fit lines
-
For Module 4
- Highlight concentration of points according to selected analysis mode and Window2 value
- Graph the min and max intensity lines based on which dataset's reference line has been selected
-
For Modules 2 and 3
-
Successful execution of data analysis does the following:
-
'Analysis Mode' dropdown is only available for Module 4
-
Computation Result Console
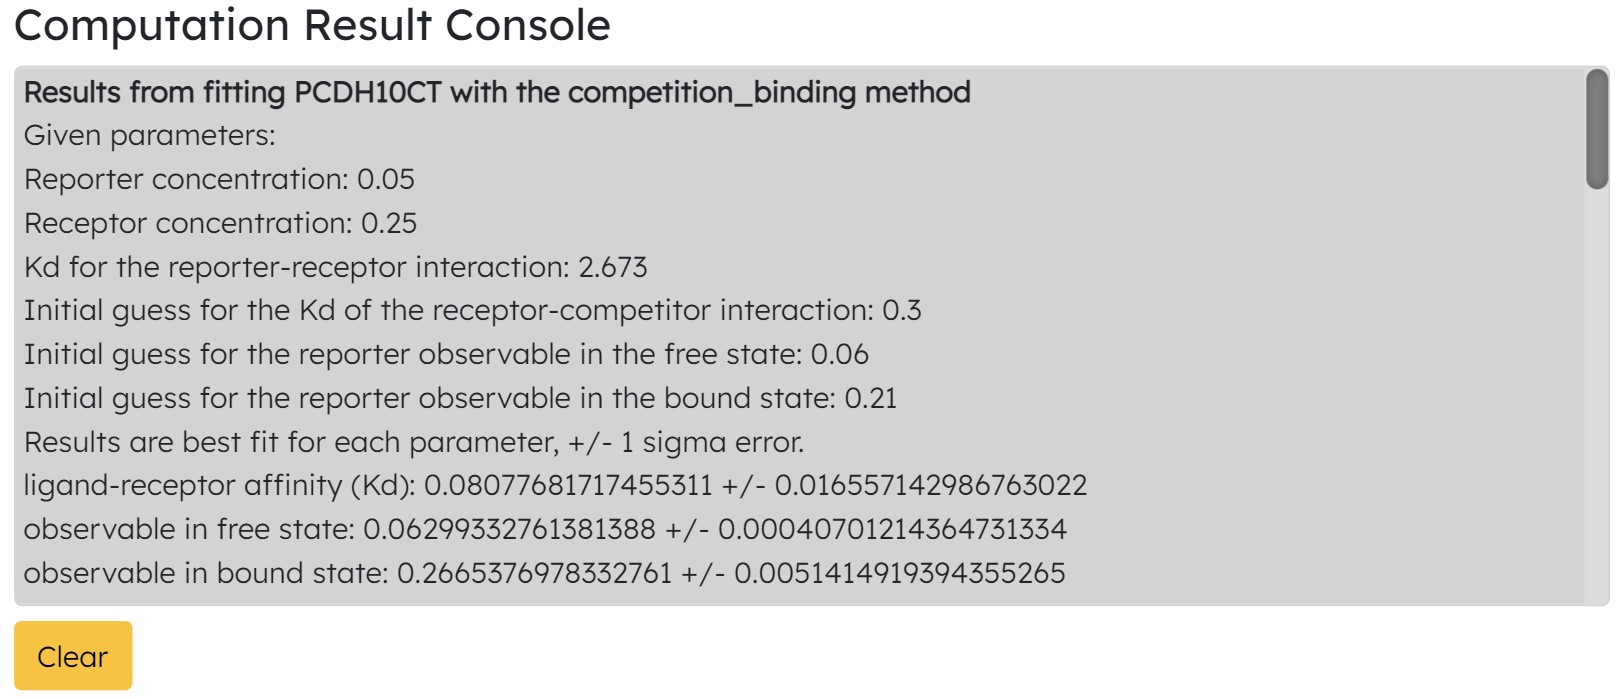
Console output for Module 3 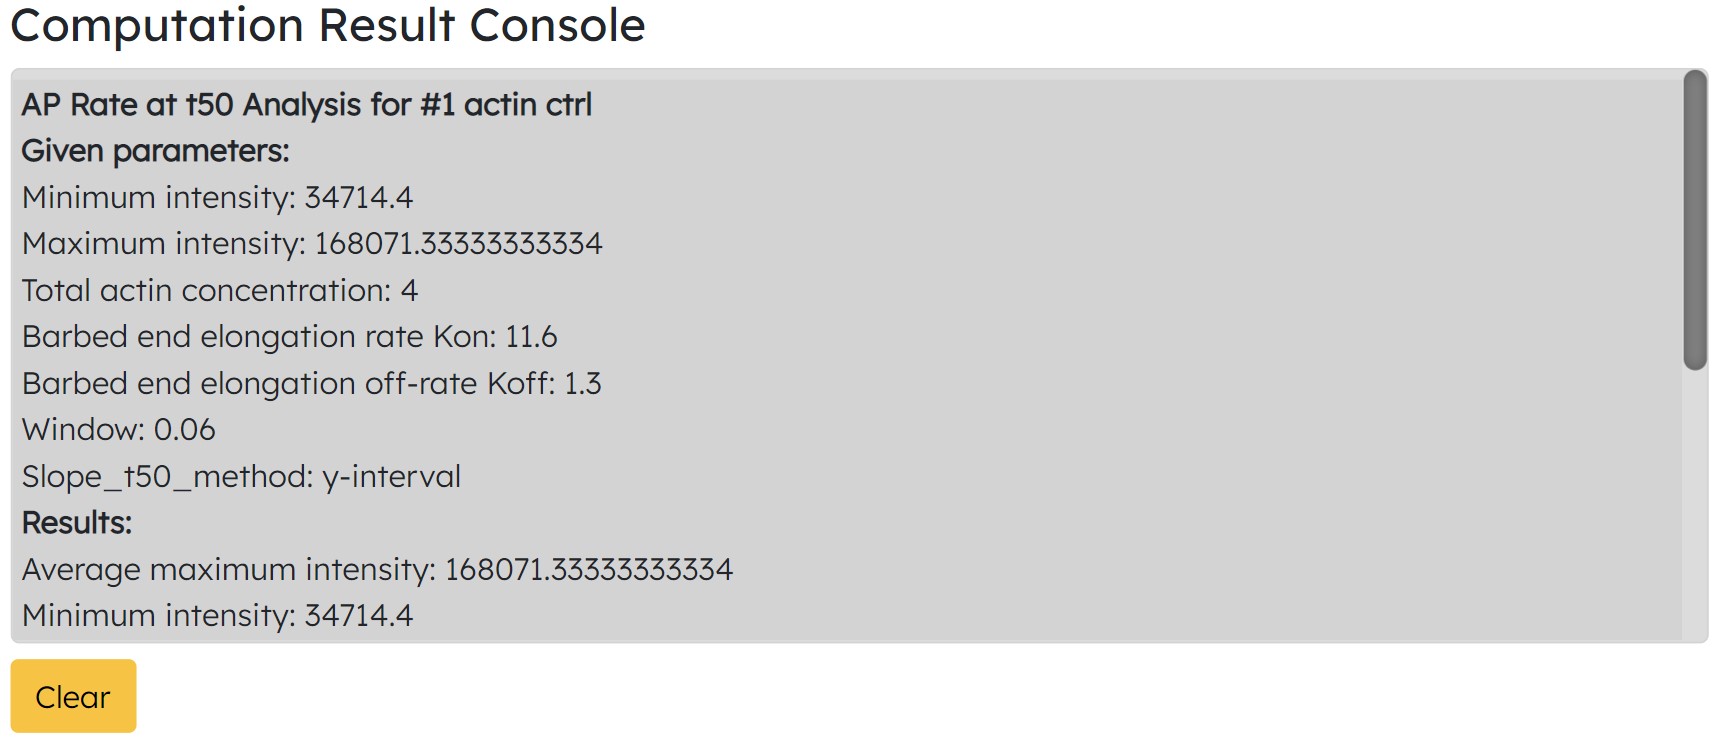
Console output for Module 4 - Found below the 'Save Session' form on the "Results" page
- Outputs the results of the computation in human-readable format after clicking 'Fit Dataset'
Session/Task Retrieval Feature
-
Create New Task From Current Session

Form for saving current session as a task that can be retrieved 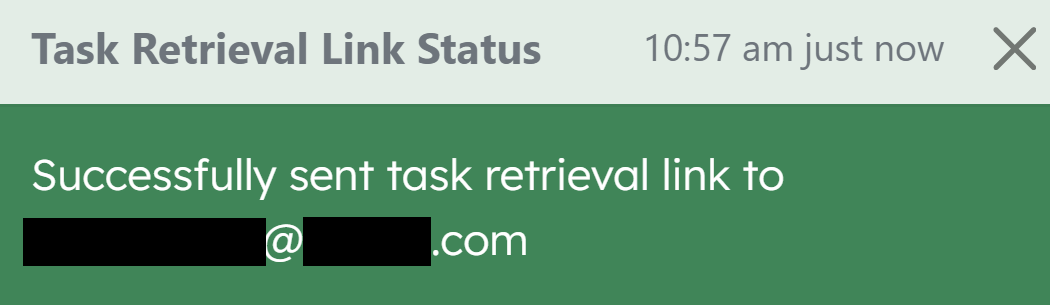
Expected message for successful creation of new task -
To save current session as a retrievable task/session:
- Provide a valid session name, no more than 50 characters
- Provide a valid email address
- Click 'Save Session As' button
-
Retrievable task/session enables users to:
- Save their graph customization selections
- Save the parameters that they provided for any of the analysis modules
-
The Session Name will be appended with 'by prefix-of-email'
-
For example,
given session name 'Mod 1 test' and email address bobby@example.com,
the full session name will be 'Mod 1 test by bobby'
-
For example,
-
Upon creation, saved task/session will be given a 7-day expiration date
-
If needed, the expiration date can be extended
(see below for more details)
-
If needed, the expiration date can be extended
-
To save current session as a retrievable task/session:
-
Retrieve and Save Changes to An Existing Task/Session
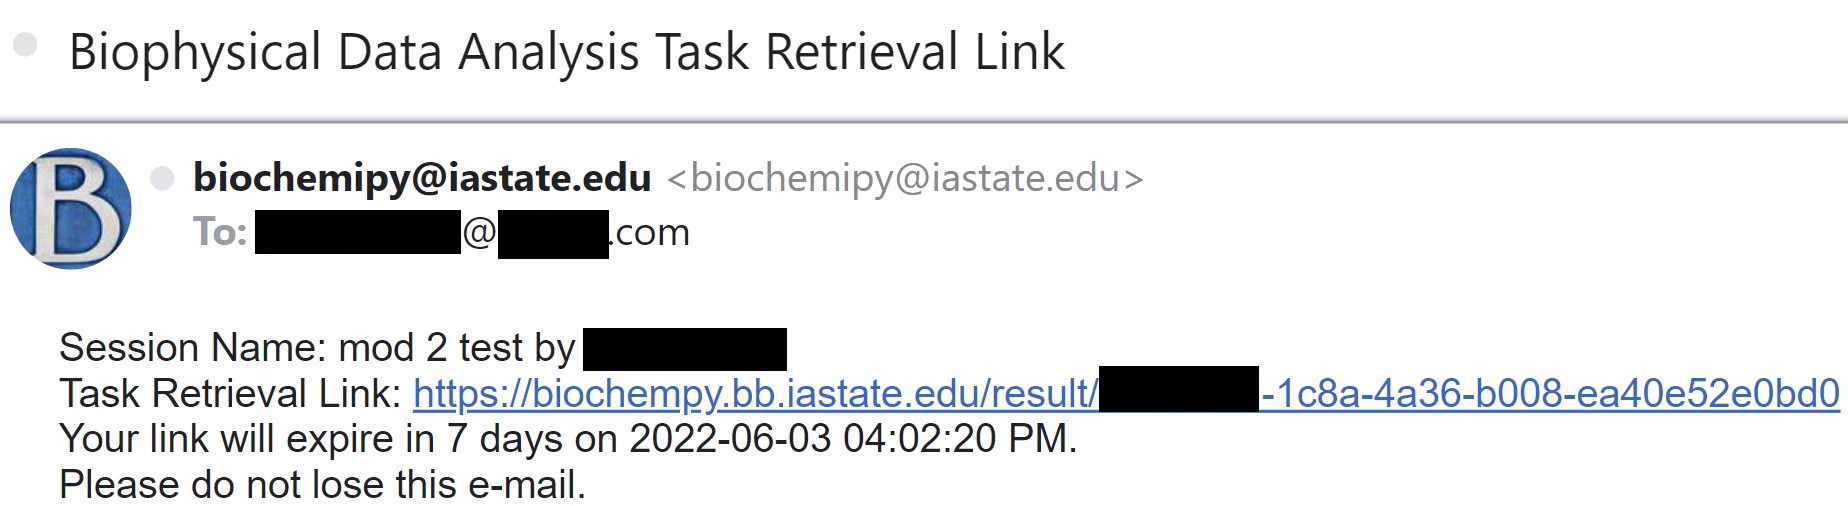
Expected email with task retrieval link 
Header on "Results" page for a saved session -
Given successful task/session creation, an email will be sent to the address provided containing the task retrieval link
- Clicking on the link will navigate the user to the "Results" page for that task/session
-
Selecting 'Save Session' will output a popup message to confirm the overwrite of previously saved information with current data
-
An option will also be given to extend the task/session for another 7 days
(e.g. the new expiration date will be 7 days from the time of the user's selection of this option)
-
An option will also be given to extend the task/session for another 7 days
-
Given successful task/session creation, an email will be sent to the address provided containing the task retrieval link